Manufacturing Execution Systems (MES) are powerful software applications that serve as the nerve center of your production processes. From the initial stages of planning and scheduling, right through to the execution and quality control, MES systems are your eyes and ears on the shop floor. They empower you to boost your efficiency, ramp up your productivity, enhance your quality, and drive your profitability, all by harnessing the power of real-time data and insights.
However, like any complex system, MES systems are not without their limitations. While they offer a wealth of benefits, there are certain constraints that can potentially hinder their full potential and performance. Understanding these limitations is key to leveraging the power of MES systems effectively. Let’s delve into some of these limitations:
- It may not have the capability to create various types of charts, graphs, maps, and dashboards that can display the data in an interactive and appealing way.
- It may not have the flexibility to customize the data visualization according to the needs and preferences of the users, such as changing the colors, fonts, sizes, and layouts.
- It may not have the functionality to update the data visualization in real-time, as the data changes and evolves.
- It may not have the integration with other platforms and tools that can enhance the data visualization, such as web applications, cloud services, and artificial intelligence.
In the era of Industry 4.0, the fusion of advanced analytics with Manufacturing Execution Systems (MES) is transforming the manufacturing landscape. Stitch Engine for Analytics, when integrated with MES, is not just about managing production processes; it’s about optimizing them. This isn’t a distant dream, but a reality made possible by the power of Stitch Engine for Analytics enhancing your MES system. It’s a leap towards detailed, data-driven decision-making, taking your manufacturing operations to the next level.
At Stitch Team, we’ve developed the unique Stitch Engine for Analytics to overcome the limitations of traditional MES systems. This tool enhances the existing all-in-one MES system, transforming it into a more powerful software that helps you manage and monitor your production processes. With our tool, you gain access to an exclusive dashboard designed for reporting, ushering in a new era of efficiency, productivity, quality, and profitability.
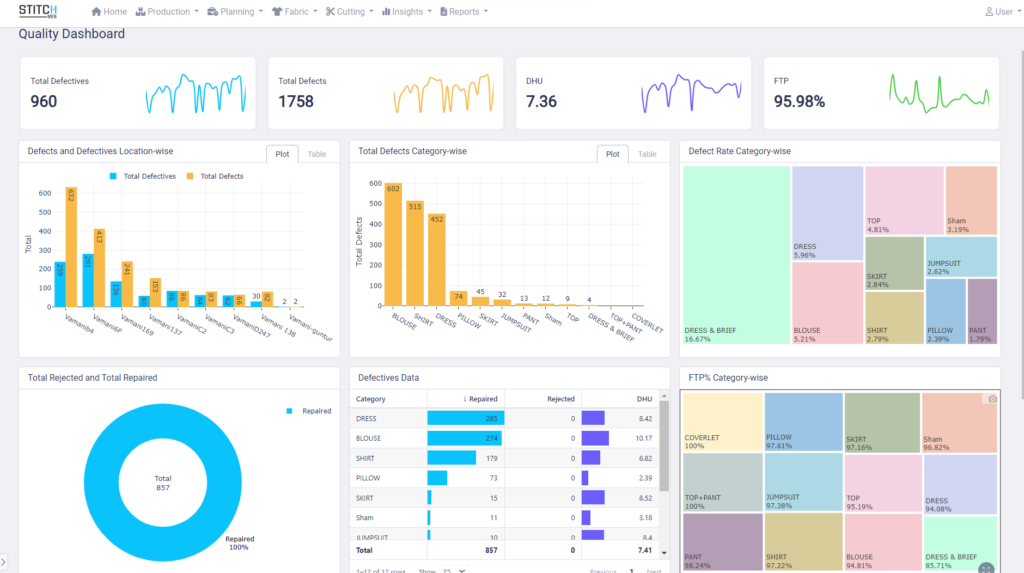
- Quality Dashboard- A Quality Dashboard is a visual tool that displays key quality metrics, offering a snapshot of product or process performance. It includes metrics like total defects, Defect per Hundred Units (DHU), First Time Pass (FTP) percentage, total rejected, and total repairs. This dashboard aids manufacturers in identifying issues, taking corrective actions, and enhancing their processes. As the saying goes, what gets measured gets managed!
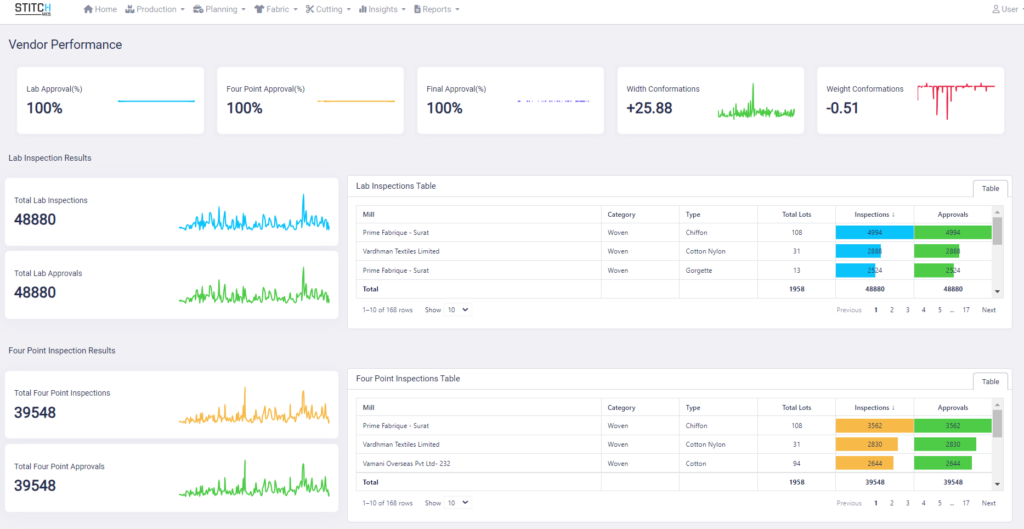
- Vendor Performance Dashboard- It is a crucial tool for vendors that provides insights into the performance of vendors in the textile and apparel manufacturing industry. It includes data related to Lab Approvals of the fabric, Four Point Approval (%), Conformations and Inspections Combined Results, Final Inspection Results, Four Point Inspection Results, Lab Inspection Results, Weight Conformations, and Width Conformations.
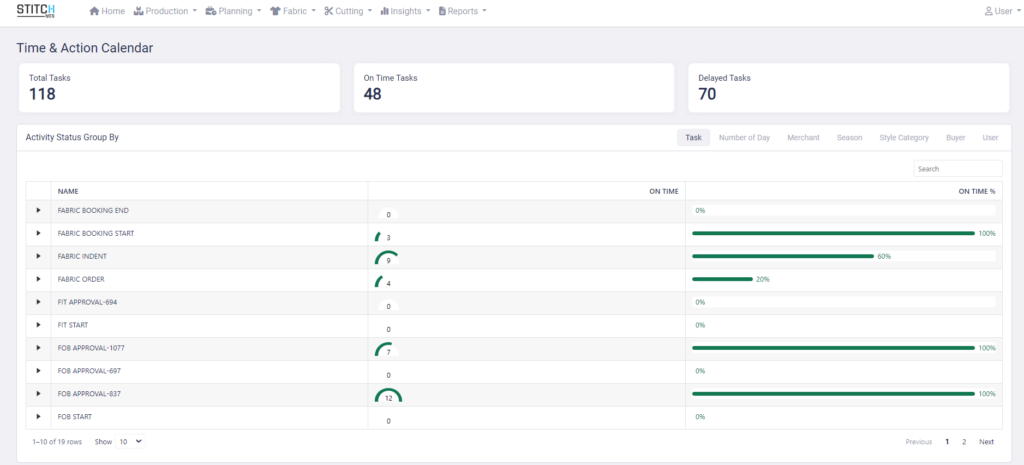
- Time and Action Dashboard- A Time and Action Dashboard is a dynamic visual tool that displays task progress and timelines in a project or process. It highlights key metrics like Total Tasks, On Time Tasks, Delayed Tasks, Fabric Booking Start, Fabric Booking End, and Fabric Indent. This dashboard is crucial in industries like manufacturing and logistics for effective task management and timely execution.
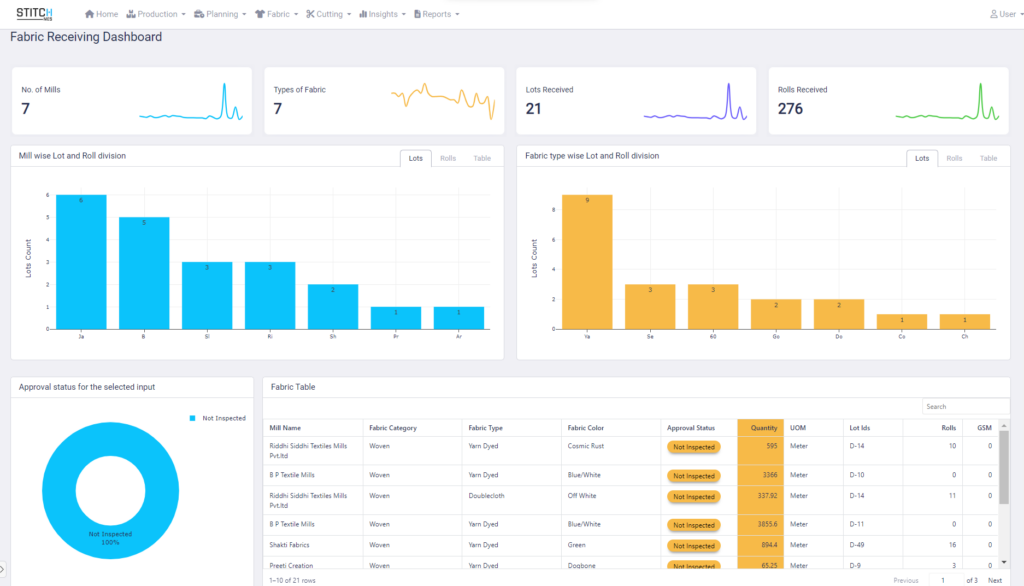
- Fabric Receiving Dashboard- The Fabric Receiving Dashboard is a powerful tool that provides manufacturers and buyers with a visual representation of key metrics related to fabric receiving. It includes data and graphs for the number of mills, types of fabric, lots received, approval status, fabric table, past order status change, and quantity trend. The Fabric Receiving Dashboard provides a clear and concise view of key metrics, enabling manufacturers and buyers to make informed decisions and optimize their operations.
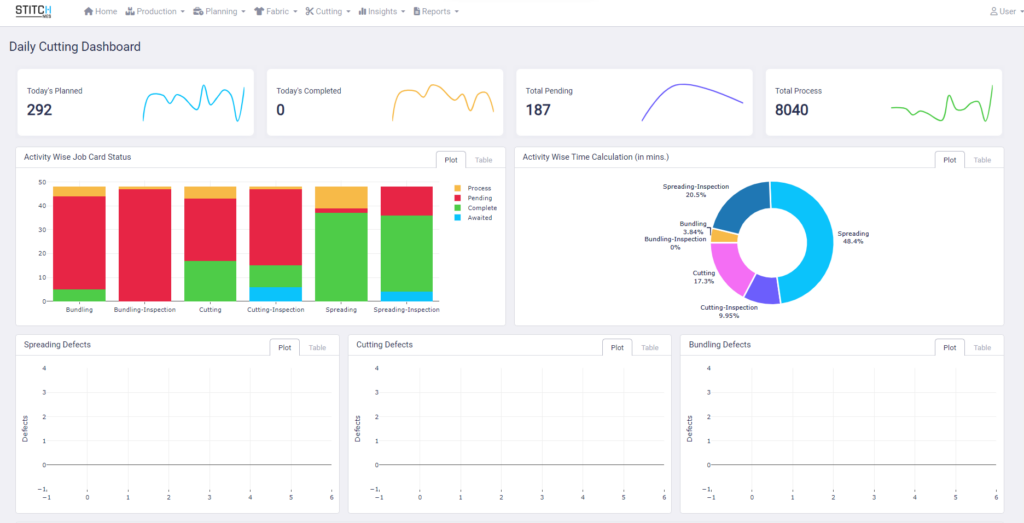
- Cutting Dashboard- The Daily Cutting Dashboard is a vital tool in the textile and apparel manufacturing industry. It provides real-time data and insights into the cutting process, enabling manufacturers to plan, monitor, and optimize their operations effectively. It enables manufacturers to stay on top of their operations, identify issues early, and take timely corrective actions. Remember, effective management starts with effective measurement!
Generate Custom Report- Stitch Engine for Analytics is a powerful tool that can generate custom reports, it provides a comprehensive view of your operations.
- Daily Section-Wise Report- Get a detailed breakdown of each section’s performance on a daily basis. This can help you identify bottlenecks and areas of improvement.
- Daily Sewing Endline QC Defect Analysis- This report can help you monitor the quality of your sewing process. By analyzing defects, you can take corrective actions promptly.
- Daily Line Efficiency- Keep track of your production line’s efficiency every day. This can help you optimize your operations and improve productivity.
But the magic of Stitch doesn’t stop at merely managing your production processes. It’s about fine-tuning them to unlock their full potential, transforming the way you operate and compete in the industry 4.0 landscape. It’s not just a game-changer; it’s a whole new ball game.


